Thursday, May 27, 2010

Valero, Refining Margins, and Making Money

It's not too hard to develop a little model of a refiner's gross variable margin: You can approximate the cost of the feedstock with WTI and if you know roughly their product mix, you can estimate the average sale price of the output, which gives a weighted-average crack spread on the finished products.


Of course, the actual gross variable margin varies a lot by company, depending on the product mix, and even by individual production unit. But, without complicating the problem too much, the model for the past few years has looked like this:
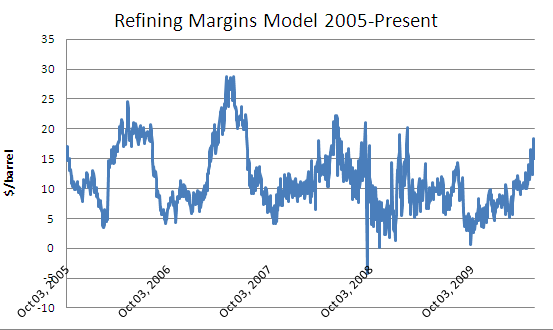


As you can see, within the last few weeks, it has recovered from the beat down experienced in late 2009 and has been looking a little better. Within the last few days, it's fallen to a bit under $11 per barrel. Note that It's not exactly the RBOB or HO crack spread, because it's a weighted average of the product mix, but it is a pretty good approximation of whether people are making any money in this business, particularly if you know the conversion cost per barrel.


Valero is an interesting company to look at sometimes, it's the largest independent refiner, they do very little upstream, and their claim to fame is the refineries they run along with the retail operations in the western 2/3 of the country. The company was put together a few years ago to buy low-entry-cost but relatively inefficient refining assets, a move which looked brilliant in 2006 when capacity was short, but for the last couple of years has been really not very good at all. They are a high-cost producer, they have lost money 5 out of the last 6 quarters, and they have recently taken steps to get out of the rut they are in by diversifying into some ethanol and alternative fuels, plus sell their worst performing refinery in Delaware.
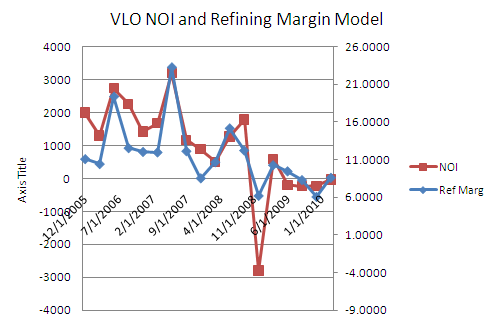


Our refinery margin calculation corresponds pretty closely to Valero's Net Operating Income (per their quarterly reports). In fact, you can see that it's the main driver of their profitability, This is not rocket science, no one is making money in retail so that is not much of a diversification.... You can see that in 2005-2006 they overachieved a little bit, in that period, capacity utilization was  higher than it is right now and they had a bit more pricing leeway. Valero's production cost, per their financials, is usually between $6.50 and $7 per barrel. Some of the more efficient majors can get their product converted for $5-6, which means that they can stay profitable while VLO bleeds money.


An even better approximation can be made by adjusting the model for the industry refinery utilization, which is a measurement of price strength (low utilization means terrible pricing) and by subtracting out the seasonality.  R-squared for this little model is about .66, pretty good. It is not at all unheard of for profitability to be off a bit in timing, like it was in 2008, and also not at all unheard of for people to dump costs into the books if they know they are going to have a bad quarter, so maybe that is what happened in late 2008 when the market collapsed.


The very fact that the profitability of this outfit is so predictable is just an indication that their business is so commoditized, and to the credit of the management they are trying to make some changes in their business to lower their conversion costs and get into some other line of business to get them out of the equation. In the meantime, we can use this information to try to predict what they're going to do in the upcoming few months. Of course it depends on what you expect the WTI and products prices to be between now and the end of the quarter, but based on a reasonable set of assumptions (an $11 dollar weighted average refinery margin and 87 percent utilization) the model suggests their NOI for the June quarter is going to be in the neighborhood of $900M, which is the kind of quarter they had in early 2008, when they made in the low 40's per share. The analyst consensus for VLO for the upcoming quarter: the low 40's per share. They have some prospects to do a little better. The refinery margin model has averaged $12.71 up until May 14th.... We'll check back at the end of June to see how they're doing. Also, we should be able to unearth this model in a couple of years and see how good of a job they did in diversifying...because their profitability will correlate less well with the model.


Of course,  all of this might or might not transfer directly to the stock price because these guys are bound to take a charge for discontinued operations, and the market itself is subject to chaos,  Still it is nice to know a little ahead of time whether they are going to make a little money, and as time goes on, I am sure the management hopes that the changes can get them more consistently profitable through all parts of the business cycle which, despite rumor to the contrary, obviously still exists.


Disclosure: none

Thursday, May 20, 2010

Historic Dance: WTI and the DJIA


You probably noticed the unusually strong correlation between the changes in the WTI price and the DJIA average that has been occurring lately. The stat people can put a number on this, it's the correlation coefficient R-squared. A value of 1 is perfect, a value of 0 is no correlation. You can pretty easily get the number for any 10-day period as far back as you want to go. "Perfect" may be either in lock step, where one goes up followed by the other, or "perfectly divergent" in which an increase in one occurs with a decrease in the other.

Between 2000 and now, the correlation between the daily price change in WTI and the Dow has averaged 0.14, pretty weak. The prices of one typically do not move in conjunction with the prices of the other very much. The R-squared value for the above 10-day period was .82, quite strong, as we have noticed.

If you go back over the last couple of years, back to early 2008, there were seven time periods during which there was a strong correlation between the WTI price change and the Dow price change, and the baseline value is much higher than the historical average.


Of these "major instances", 6 of the 7 were similar to the case above, The lone exception was the period in May of 2008 during which the WTI price and the DJIA price were strongly divergent;


In fact, historically, this was the more common occurrence. Take this example, which occurred during the Iraq invasion of Kuwait and run up to Operation Desert Storm:


There were four instances between August of 1990 and September of 91 during which the two markets danced either together, or divergently.

But, the point is this: As far back as the WTI records go, to 1983, the incidences of the WTI and Dow being closely correlated (defined by an R-squared of greater than .7) are exceptionally rare. Even during the DJIA meltdown in 1987, WTI scarcely moved. Since 1983 there have only been 16 events of this nature, and 7 of them have occurred in the last 2 years, since the financial problems started to show up in the global economy.

So for the time being, the caution for parties interested in either index is: we are witnessing an unprecedented dance between the WTI price and other measurements of market value. No doubt both are being influenced by the same market emotion or other underlying factor, i.e. the strength of the dollar and general stability in the financial system. The strong correlation is undoubtedly a sign of continued stress in the financial system and other markets.

Tuesday, May 11, 2010

Nominal Capacity vs. Stated Capacity

The stated system capacity, by which the refinery utilization is computed, is about 17.4 mbpd.

If you take the stated refinery utilization, which last week was 89 percent, and compute the theoretical inputs (purple line) there is about a 2 percent gap, which means the system is not actually taking in as much crude oil as the nominal calculation says that it should.

This gap has increased in the last few weeks as the system comes out of its slumbering mode.....it represents some refinery inefficiency, and more likely, represents the fact that the system is not capable of taking as many barrels per day as the reports state.

Monday, May 3, 2010

Fun Week for the Inventory Report


First of all, we have the oil disaster unfolding before us out in the GOM. and we will finally start getting some kind of number associated with the lost production as well as the effects of the nearby pipeline that they had to shut down when this thing started to burn. We did not see it in last week's numbers but I think the domestic production will be down around 5.3 which is .1 mbpd less than it was.

No one is talking about it but the burning platform is only about 100 miles from the LOOP, and as that slick gets bigger and bigger, there will have to be some effects on the movements of tankers in this area.....Luckily the LOOP is farther west, and the current is pushing the slick east (toward Florida's pristine beaches) It is anyone's guess how big and deep this mess would have to be before they talk about shutting down the LOOP but if they do, we are talking about 3 mbpd not coming into the country via that path. I think about 1.4 mbpd typically comes in around Houston and the remaining roughly 1 mbpd elsewhere, just as a reference.

Secondly we have the issue of refinery utilization. We talked last week about the refiners now being up to 89 percent, which is as high as I thought they were going to be at the peak this year, but per the graph above, this is actually comparable to the pre-recession average, so that system is up and running at least for the moment. As a result we are going to have to see something approaching 15.3 crude oil inputs to refineries....

Thirdly, the driver behind the refiners gearing up is obviously this unleaded demand situation, which was up over 3% year on year, and not quite up to pre-recession levels but getting pretty close, I think. The archive of doom says that the 2008 products supplied for this week was 9.3 and we are talking about 9.2 as of last week....

So, assuming last week was not a blip we are looking at the potential for the crude oil inventory change being right about even and if the imports are not 10 mbpd we are talking about a drawdown, and that would really throw a bit of excitement into this marketplace which has seen 12 straight builds in inventory.

There is an underlying sub-plot on distillates: Unleaded demand has picked back up to the pre-recession levels, but diesel has not. You are going to see bigger and bigger builds in the distillate inventory because of this.


So, we will have to continue to watch the news and wait to see what happens but there may be some surprises on the report this week....

I see that the front contract is back up over 86. maybe you will see 90 in a few days.....More fun later..

Friday, April 30, 2010

The Real Cost of the Louisiana Oil Slick


The real cost will be in terms of "second thoughts"....

Say you are planning a project. It's risky enough, leasing one of these giant platforms, it costs you hundreds of thousands per day. You drill a hole in deep water, as much as 10,000 feet, and then downward into the geology from that. Costs money. You might or might not get as much product out of it as you originally planned.

The calculation you do is pretty simple: Cost of drilling versus expected payback, given the price you think you can get some years in the future for the crude oil, and the amount of crude oil is only an estimate.

Now, add to this calculation the possibility that you are found responsible for the biggest oil slick since the Exxon Valdez. Cleanup, fines, lawsuits.... It took Exxon a decade or more of legal fees to fight the fines they had for defiling Prince William Sound.

The boss might be a geologist, but the bean counters that are advising him are saying: "this business is stupidly risky. Let's just drill the least risky projects we have and leave this to Exxon"....

A further point: At this point, are you going to drill offshore South Beach in Florida? What about off the Florida Gulf Coast where all of the millionaire mansions are? Cape Cod? This did more to kill off "drill baby drill" than a years' worth of protests. The images in the next few weeks will start to come in: Oily water birds, dead alligators along all of that swampland, all of those docked shrimp boats..... it is going to be worse than Katrina for some of these communities.

Do you know what will turn a Republican into a Democrat? A big oil slick washing up in front of his beach house.

So the real cost will be: Second thoughts. People will rethink the projects they have and discount them based on the risk. People will see the extent of the catastrophe and rethink the wisdom of some of these other drilling projects.

What won't get rethought, for awhile yet, is the idea that we are dependent on this toxic mess for the lifeblood of our economy and our society. That's the real root cause. Maybe that is around the corner... if the Peak Oilers are right.

Monday, April 26, 2010

Spring Refinery Utilization and Import Model


I am in a graphing mood this morning. Note the above graph of unleaded products supplied, a.k.a "unleaded demand" for the last few years. The pattern was pretty consistent from 2005-2008 but in 2009 something really interesting happened: Everyone went out of town for Easter (April 15) and Memorial day, but aside from that, they parked the Family Truckster and stayed home.

You can see a really similar blip happening this year, since Easter was April 5th, it's offset by a couple of weeks, but we can sort of envision demand being more like last year than the previous two years. I am thinking unleaded products supplied will be about 9 this week, and eventually, in some trajectory, end up somewhere between 9.2 and 9.3 by the 4th of July. Maybe there will be a blip for Memorial Day like there was last year, with less traffic the weeks before and after....In another week or two we will have a lot better idea.

So to meet this demand, the refiners are going to scale up, because that is what they do, and people do what they do. They could probably satisfy any additional demand without running the refineries by increasing the imports around May 1, and that is indeed a possibility, but it seems pretty likely, based on our little observation, that the refinery utilization will be pretty close to what it was last year. The scale-up period this year happened a bit different than in 2008-2009, but I do not think they will be crazy enough to run at the same rate as the pre-Recession level.

So, if we make the educated guess that they are going to scale up from where they are now, which is 85.9% utilization to around 89, being a little generous because of the slightly higher demand this year, and this will happen in some sort of nearly linear trajectory, there will have to be some level of crude oil imports to support the increase. At the level of 9.3 mbpd, you can see that the overall crude oil inventory will decrease, at 9.8 a bit of a decrease, and at 10.3 a pretty substantial increase, assuming 5.4 mbpd domestic production, and inputs to refineries in about the same ratio as it is right now.

So, based on what we see here, what do you think imports will be over the next few weeks? Well, I think our friend the refinery manager went into the cubicle of his crude oil buyer sometime in the last month, and said the following: "I want you to order enough crude oil every month to keep our tank full. The reason for this is that the contango situation is telling us that crude oil will be more expensive in 2011 than it is in 2010. The way to minimize your cost over the next year is keep crude oil in storage. Here is our scale-up schedule. Make it happen. If the tank is not full, I want you to order a little extra every month and we will worry about finding a place for it later.".....

So, the third graph is three inventory scenarios, using different levels of crude oil imports, given the above assumptions about demand, refinery utilization, and inventory strategy....I did do the "goal seek" on this to determine that an import rate of 9.96 mbpd will be needed to keep the inventory of crude oil stable between now and the beginning of July, and I think that is exactly what is going to happen,

So, based on this, you turn the crank and get the forecast that we have posted in

http://usoilinventories.com/forecasts/default.html

The unleaded and distilate products supplied are running just about what our original model said, maybe a bit of fudging for Easter, but pretty close. The refiners are going to increase by about 0.3% per week, to get to 89% by July. Domestic production will be down a bit because of the platform disaster still unfolding out in the Gulf. Imports will have to increase to 10.0 at some point to keep the inventory stable, and I am guessing that this will happen sooner rather than later. We will continue to tilt the finished product ratio toward unleaded and away from distillates, because there are too many distillates around, with demand the way it is..... and summer around the corner.

So, I am seeing builds in all three of the categories this week. The post-Easter demand blip will hit unleaded and we will see a little build in that, and the rest is self-explanatory.

We science guys think like this. We can be like the meteorologists and come up with a theory about what is going to happen, and test it out by observation over the next couple of months. It will be interesting to see what happens.

Monday, April 19, 2010


Here is the validation of the demand model that we produced in early March. The unleaded demand is consistently running slightly over the model, and the distillate demand, with the exception of the week-to-week variability that we noticed in this data because of the variability in weather that causes some fluctuation in the five year averages, is pretty close to on-track.

Since these two models were developed based strictly on the seasonality, I think we can deduce from this that the demand for unleaded is actually about 91 tbpd greater than the seasonality suggests, so maybe the economy is a little stronger than we suspect. I have also adjusted my distillate model to smooth out some of the variability and assume that the demand will decrease roughly linearly between now and June....

So I agree with Geithner, that the economy is improving a little bit, but the depression conditions in the trucking industry are still continuing..... as evidenced by weak distillates demand.